Executive Summary
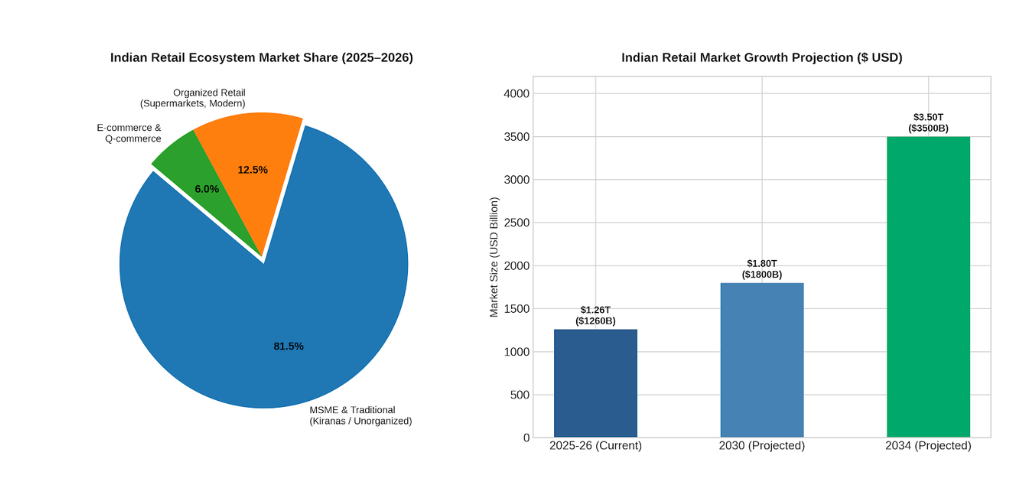
India's retail sector represents one of the largest and fastest-growing markets in the global economy, valued at approximately $1.12 Trillion to $1.40 Trillion USD in 2025–2026 [1, 3]. Micro, Small, and Medium Enterprises (MSMEs), along with traditional neighborhood Kirana stores, form the structural backbone of this sector, commanding over 80% to 85% of total retail trade [2, 5]. Driven by rapid urbanization, rising disposable income, digital public infrastructure (UPI) [7], and supply chain modernization, total Indian retail is projected to scale to $1.8 Trillion by 2030 [1, 2] and $3.5 Trillion by 2034 [3].
|
$1.26T
Current Market Midpoint
|
80% - 85%
MSME / Kirana Share
|
12M - 13M+
MSME Retail Outlets
|
11.5%
Projected CAGR (2025-30)
|
1. Overall Retail Market Size & Growth Trajectory
The Indian retail market is experiencing structural expansion supported by macroeconomic stability, demographic tailwinds, and increasing consumer spending across Tier-2, Tier-3, and rural regions [1, 6].
| Metric / Variable | 2025–2026 (Current) | 2030 (Projected) | 2034 (Projected) |
|---|---|---|---|
| Total Retail Market Size (USD) | $1.12 Trillion – $1.40 Trillion [1, 3] | $1.80 Trillion [1, 2] | $3.50 Trillion [3] |
| Total Retail Market Size (INR) | ₹93 Lakh Cr – ₹115 Lakh Cr | ~₹150 Lakh Cr | ~₹290 Lakh Cr |
| Annual Growth Rate (CAGR) | 11.0% – 12.8% [2, 3] | ~11.5% | ~12.0% |
| E-commerce & Q-Commerce Share | 6.0% – 8.0% [6] | 12.0% – 14.0% [6] | 18.0% – 20.0% |
2. Deep Dive: MSME & SME Share in Indian Retail
In India, retail is overwhelmingly decentralized. Unlike developed Western markets dominated by large retail conglomerates, India's commerce engine relies on over 12 to 13 million small retail entities [4, 5].
- Market Valuation of MSME Retail: MSME retail operations account for approximately $900 Billion to $1.15 Trillion USD (₹75 Lakh Cr to ₹95 Lakh Cr) [2, 5].
- Employment Generation: Small retail stores provide direct and indirect employment to over 40–50 million people, making retail the second-largest employment sector in India after agriculture [4].
- Food & Grocery Dominance: Food and grocery comprises ~65% of all consumer spending in India. Within this category, MSME Kirana stores maintain an estimated 88% to 90% market share due to proximity, trust, flexible credit extension (khata system), and localized product curation [5].
3. Channel Wise Market Breakdown
The Indian retail landscape is divided into three primary channels, each presenting unique operational dynamics:
| Retail Channel | Market Share (%) | Estimated Value ($ USD) | Key Characteristics |
|---|---|---|---|
| MSME / Unorganized (Kirana) | 80.0% – 85.0% [5] | $900B – $1,150B | Hyper-local, low overhead, cash & UPI dependent, strong neighborhood loyalty. |
| Modern Organized Trade | 12.0% – 15.0% [2, 5] | $150B – $200B | Supermarkets, hypermarkets, mall chains, unified customer experience. |
| E-Commerce & Quick Commerce | 6.0% – 8.0% [6] | $70B – $100B | App-first ordering, 10-30 min deliveries (Q-commerce), rapid Tier-2/3 expansion. |
4. Category-Wise Distribution
Consumer expenditure across product categories reflects the necessity-driven nature of Indian household spending, with groceries holding the majority share followed by apparel and electronics [5].
| Category | Share of Total Retail (%) | MSME/Kirana Penetration | Growth Trend |
|---|---|---|---|
| Food & Grocery | 62% – 65% | Very High (88%–90%) [5] | Steady (8–10% CAGR) |
| Apparel & Footwear | 8% – 10% | Moderate (60%–65%) | High (14–16% CAGR) |
| Consumer Electronics & Mobiles | 6% – 8% | Moderate (45%–50%) | Very High (15–18% CAGR) |
| Pharmacy & Healthcare | 4% – 5% | High (75%–80%) | Strong (12–14% CAGR) |
| Home Decor, Jewellery & Others | 12% – 15% | High (70%–75%) | Moderate (10–12% CAGR) |
5. Key Trends & Strategic Outlook
A. Digital Transformation & "Phygital" Integration
The narrative around Indian retail has shifted from "E-commerce vs. Kirana" to digital integration. Over 85% of urban Kiranas now accept Unified Payments Interface (UPI) payments [7]. Furthermore, B2B procurement platforms like Udaan, JioMart Digital, and Reliance Retail B2B have modernized inventory replenishment for small traders.
B. Rise of Quick Commerce (Q-Commerce)
Platforms such as Blinkit, Zepto, and Instamart are expanding rapidly in Metro and Tier-1 cities [6]. While Q-commerce competes directly with Kiranas on top-up grocery purchases, many traditional retailers are adapting by partnering with local hyper-local delivery apps or implementing WhatsApp-based ordering.
C. Open Network for Digital Commerce (ONDC)
The Government of India’s ONDC initiative aims to democratize digital commerce by enabling small MSME merchants to be discovered across multiple buyer apps without paying high platform commission fees [4, 8].
6. Bibliography & Direct Hyperlinked Sources
Official Web Link: https://www.ibef.org/industry/retail-india
Cached Copy (PDF): IBEF-Annual-Report-2023-24.pdf
Official Web Link: https://mediabrief.com/bcg-and-rai-unveil-winning-codes-for-retail-2035-report...
Cached Copy (PDF): Indian_Retail_Market_and_MSME_Analysis-v3.pdf
Official Web Link: https://www.imarcgroup.com/india/reports
Official Web Link: https://www.pib.gov.in/PressReleasePage.aspx?PRID=2089308
Cached Copies (PDF): PIB-report.pdf | Year End Review - 2021 Ministry of MSME.pdf
Official Web Link: https://www.ibef.org/industry/retail-india
Official Web Link: https://www.ibef.org/industry/retail-india
Official Web Link: https://www.ibef.org/industry/retail-india
Official Web Link: https://www.pib.gov.in/PressReleasePage.aspx?PRID=2089308